
Analyze Apache HTTP server access log with Pandas
data-analysis pandas pythonIn the last post we saw how to read an Apache HTTP server access log with pandas. We ended with a dataframe structured like this:
| ip | timestamp | size | referer | user_agent | resource |
|---|---|---|---|---|---|
| X.X.X.X | 2015-11-23 18:17:40+00:00 | 5303 | NaN | Mozilla/5.0 (Windows NT 5.1; rv:6.0.2) Gecko/2... | / |
| X.X.X.X | 2015-11-23 18:52:14+00:00 | 1550 | https://duckduckgo.com | Mozilla/5.0 (X11; Ubuntu; Linux x86_64; rv:42.... | / |
| X.X.X.X | 2015-11-23 19:16:48+00:00 | 1513 | NaN | Mozilla/5.0 (Windows NT 5.1; rv:6.0.2) Gecko/2... | / |
| X.X.X.X | 2015-11-23 19:16:56+00:00 | 5303 | NaN | Mozilla/5.0 (Windows NT 5.1; rv:6.0.2) Gecko/2... | / |
| X.X.X.X | 2015-11-23 19:24:38+00:00 | 2754 | https://www.google.com/ | Mozilla/5.0 (Windows NT 6.3) AppleWebKit/537.3... | /querying_hive |
Here's we'll do some data wrangling and aggregation to display information about this website visits. Let's start:
import pandas as pd
import matplotlib.pyplot as plt
Referer
Information about the page that linked to a resource of our page.
referers = data['referer'].dropna()
Referers domain
The two more common referer domains from the total referers (normed):
domains = referers.str.extract(r'^(https?://)?(www.)?([^/]*)')[2].str.lower()
domains.value_counts()[:2].divide(domains.count())
mastortosa.com    0.280564
google.com        0.145877
Name: 2, dtype: float64
The most common referers are pages of this website.
Google searches
Google queries that linked this website:
google_searches = referers[referers.str.contains(
    r'^(https?://)?(www.)?(google.[^/]*)/search?')]
google_queries = google_searches.str.extract(r'[?&]q=([^&]*)&?')
google_queries = google_queries.str.replace('+', ' ')
google_queries[:5]
3812             scikit image vs opencv
4143     pandas code datetime.timedelta
5276                 opencv get skimage
5277                 opencv get skimage
5974    comparison opencv scipy.ndimage
Name: referer, dtype: object
Time
Information about the visits over time.
Visits by week day
Normed count of visits by week day (being Monday the first day of the week):
data['weekday'] = data['timestamp'].apply(lambda x: x.isoweekday())
weekdays = data.groupby('weekday')['ip'].agg(len)
weekdays = weekdays.divide(weekdays.sum())
weekdays
weekday
1    0.145757
2    0.142374
3    0.134118
4    0.144539
5    0.139261
6    0.152389
7    0.141562
Name: ip, dtype: float64
weekdays.index = ['mon', 'tue', 'wed', 'thu', 'fri', 'sat', 'sun']
weekdays.plot(kind='barh')
plt.title('Visits over the week')
plt.xlabel('visits (normed)')
plt.show()
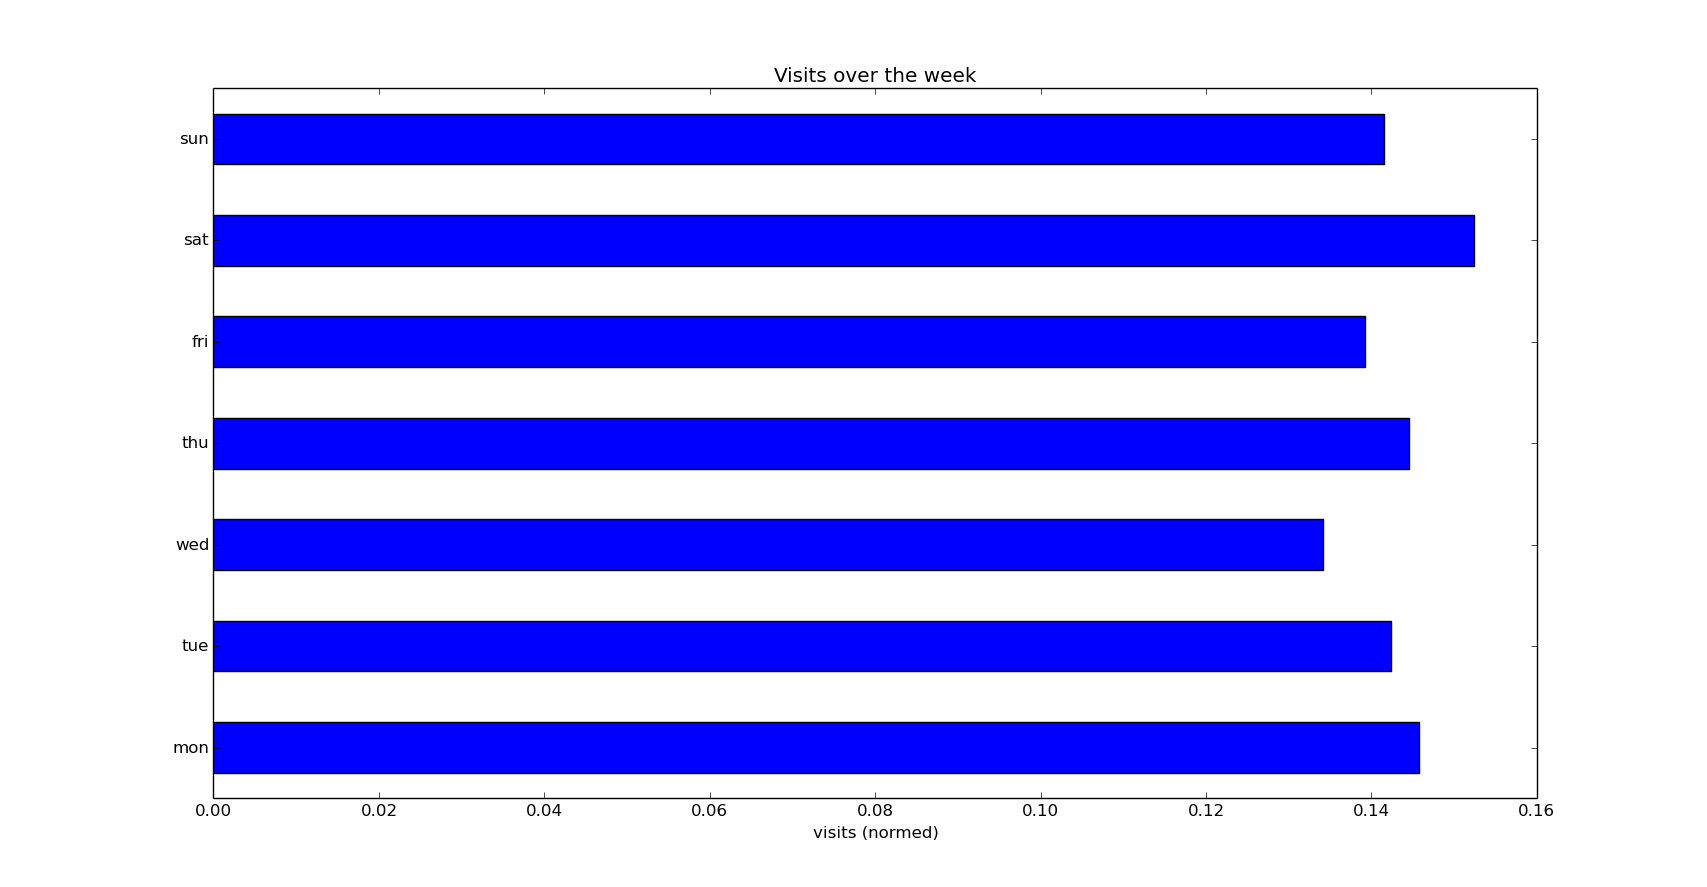
Not big differences between them, but Saturday leads the number of visits.
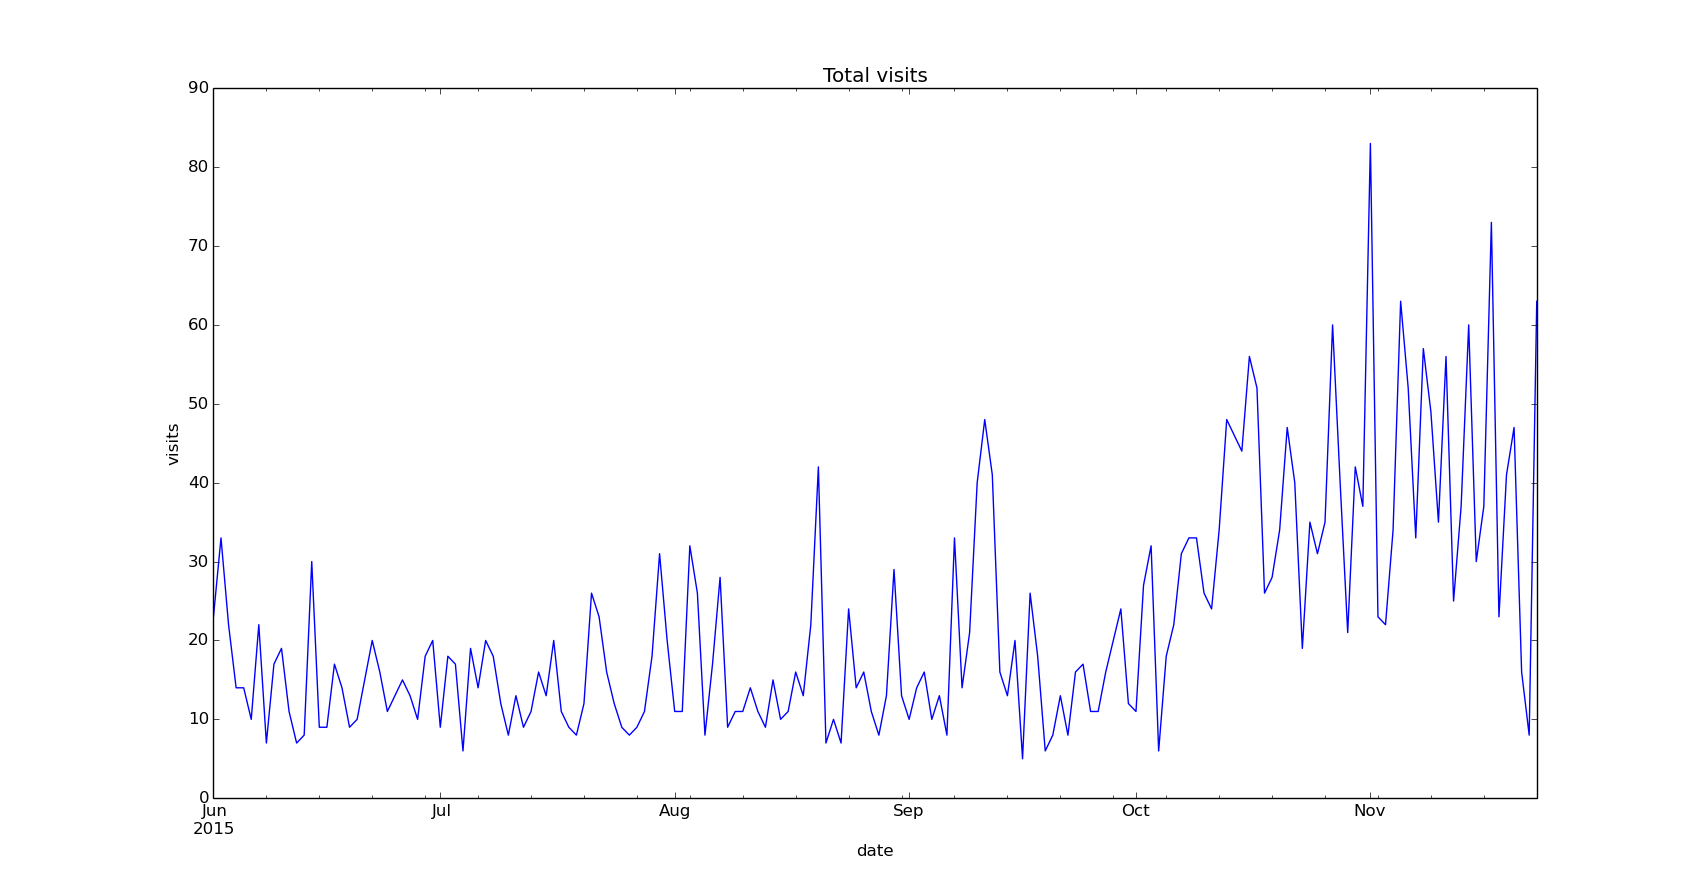
Total daily visits
Plot the daily visits counts since June 2015:
visits = data['resource'].copy()
visits.index = data['timestamp']
visits = visits.resample('D', how='count', kind='period')
visits.index.name = 'date'
visits['6/2015':].plot()
plt.title('Total visits')
plt.ylabel('visits')
plt.show()
Content
Information about the content visited within the website.
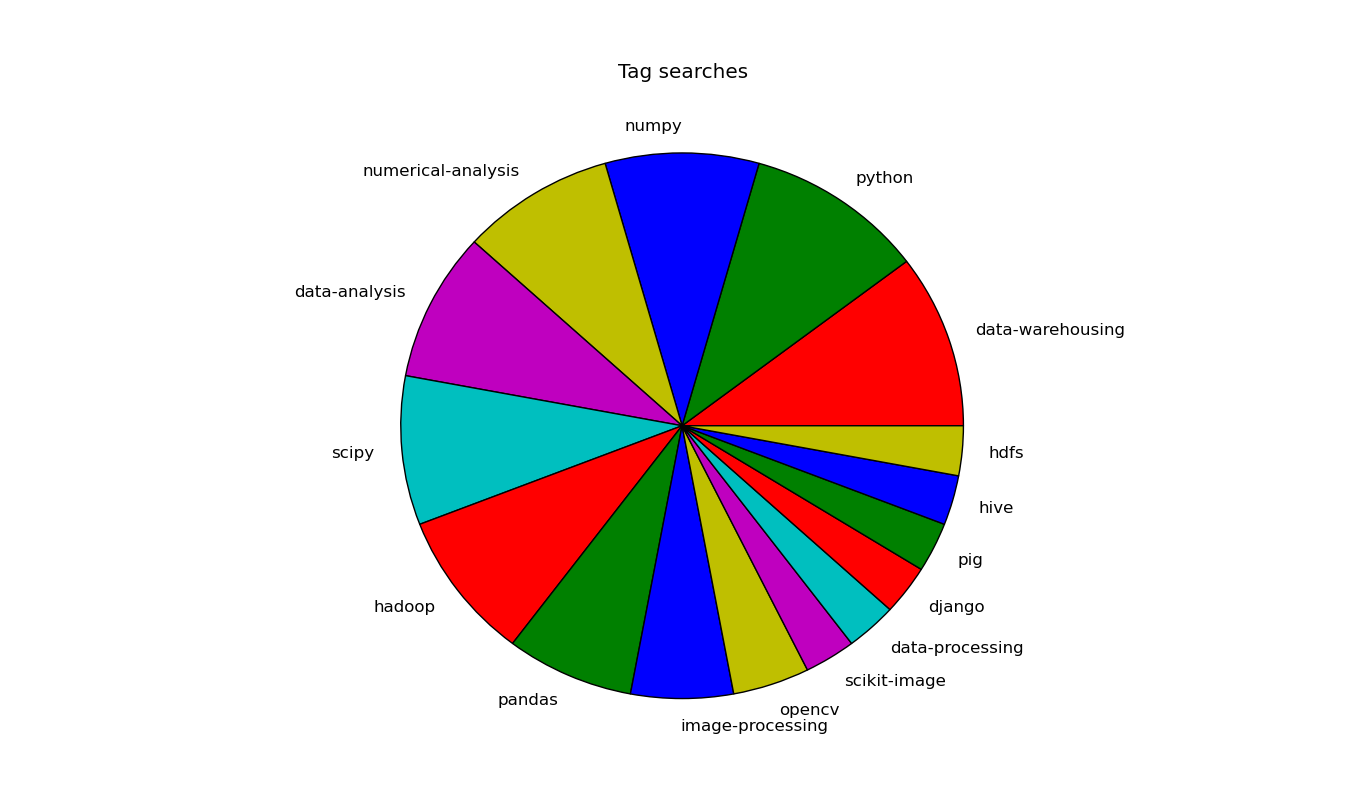
Tags searches
Searches from the site made by tag:
visits = data['resource'].copy()
tags = visits[visits.str.match(r'/tags/')]
tags = tags.str.extract(r'/tags/(.*)')
tags.value_counts().plot(kind='pie', colors=list('rgbymc'))
plt.title('Tag searches')
plt.xlabel('')
plt.ylabel('')
plt.show()
Entries visited
To get the visits per entry we need to clean the resource URI. In this case, we have to filter out the home page (/) visits as well as the searches by tag (/tags/{tag}). Also, previously there were two sections in this website, blog and lab, so the visits to these sections have to be filtered out too and, later, assume the entries within these sections as entries with the current URL map (this means everything after /blog/ or /lab/ will be assumed as directly appended to the root /):
visits = data['resource'].copy()
visits.index = data['timestamp']
entries = visits[visits.str.match(
    r'(?!.*/tags)(?!^/blog\/$)(?!^/lab/$)/[^\?]+$')]
entries = entries.str.replace(r'/blog/|/lab/', '/')
entries[:10]
timestamp
2015-02-13 08:25:06+00:00                  /simple-web-analytics-python-pandas
2015-02-13 08:25:17+00:00    /web-visits-data-analytics-javascript-python--...
2015-02-13 08:42:14+00:00    /web-visits-data-analytics-javascript-python--...
2015-02-13 08:42:24+00:00                  /simple-web-analytics-python-pandas
2015-02-13 08:58:19+00:00                  /simple-web-analytics-python-pandas
2015-02-13 08:58:26+00:00    /web-visits-data-analytics-javascript-python--...
2015-02-13 09:01:38+00:00    /web-visits-data-analytics-javascript-python--...
2015-02-13 09:02:04+00:00                  /simple-web-analytics-python-pandas
2015-02-13 10:18:36+00:00    /web-visits-data-analytics-javascript-python--...
2015-02-13 10:18:39+00:00                  /simple-web-analytics-python-pandas
Name: resource, dtype: object
The set of entries:
for i in entries.unique():
    print i
/simple-web-analytics-python-pandas
/web-visits-data-analytics-javascript-python--geoip
/python-image-processing-libraries-performance-opencv-scipy-scikit-image
/freelance-invoices-manager
/hadoop_practical_introduction_mapreduce_python
/hadoop_streaming_practical_introduction_mapreduce_python
/data_analysis_apache_pig_practical_introduction
/data_analyisis_apache_hive_practical_introduction
/loading_data_hive
/querying_hive
/interpolation_scipy
/optimization_scipy
/least_squares_fitting_numpy_scipy
/read_apache_access_log_pandas
To get the number of visits of an entry within a period of time, like Optimization methods in Scipy in November, just:
(entries['11/2015']=='/optimization_scipy').sum()
21
Show the daily visits over November of three different entries and the total of entries visits:
urls = [
    '/python-image-processing-libraries-performance-opencv-scipy-scikit-image',
    '/interpolation_scipy',
    '/optimization_scipy'
]
entries = entries['11/2015']
all_entries = entries.resample('D', how='count', kind='period')
for i, url in enumerate(urls):
    entry = entries[entries==url].resample('D', how='count', kind='period')
    entry.index.name = 'date'
    plt.subplot(int('31%d' % (i+1)))
    plt.title(url)
    all_entries.plot(kind='area', color='k', alpha=.1)
    entry.plot(kind='area', color='g', alpha=.7)
    plt.legend(['all entries', 'entry'], prop={'size': 12})
    plt.xlabel('')
    plt.ylabel('visits')
plt.subplots_adjust(hspace=.5)
plt.show()
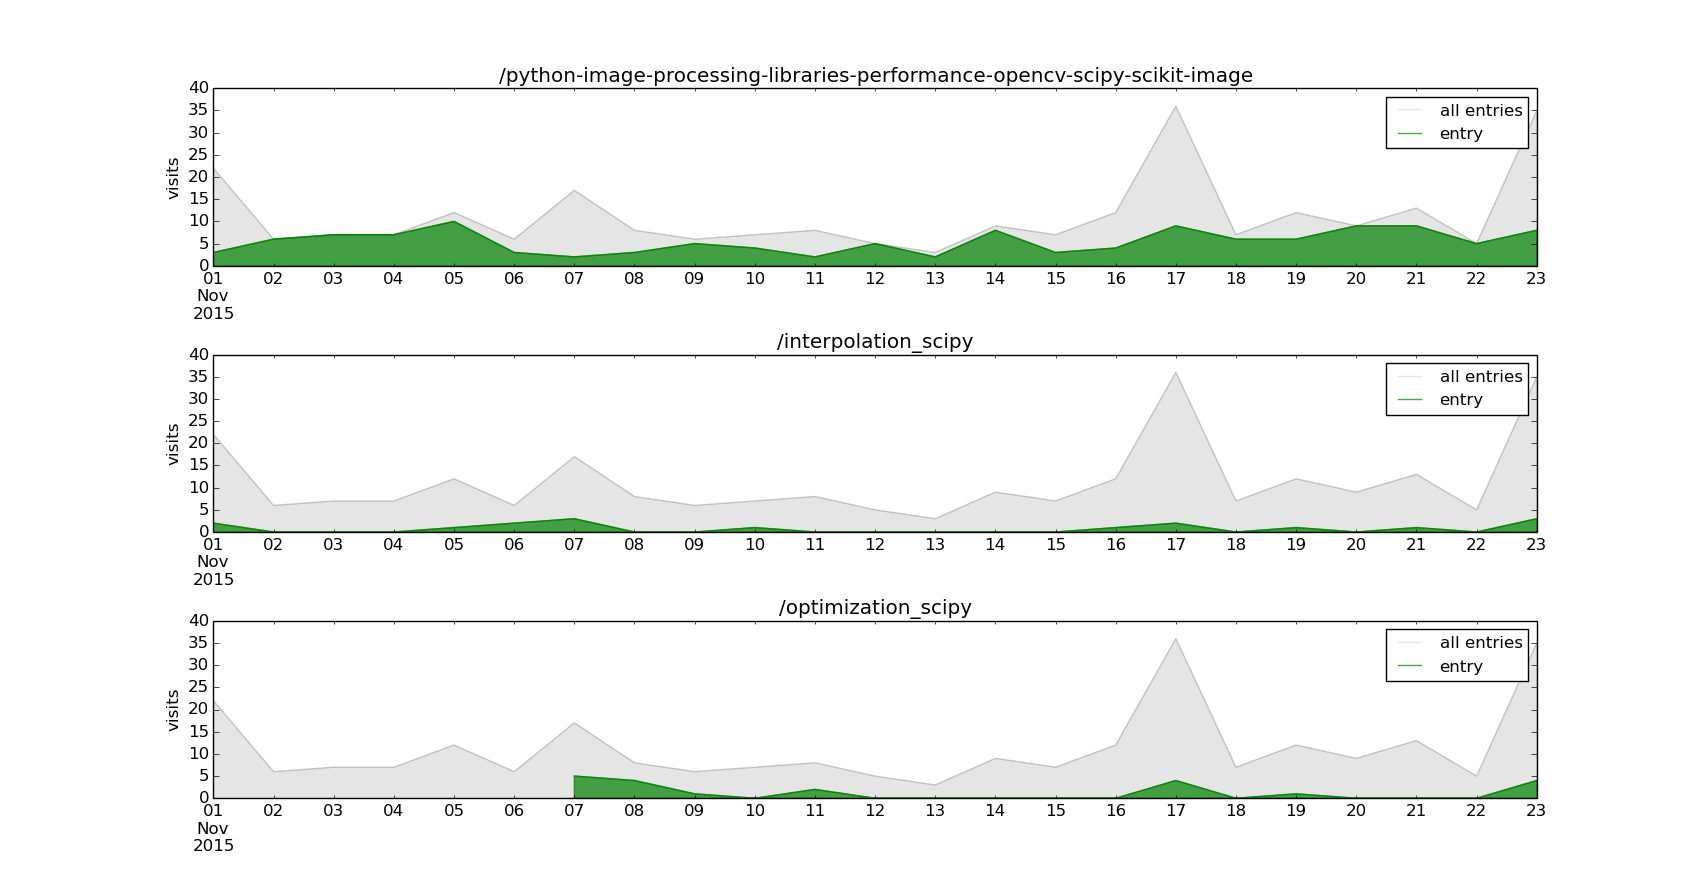
This month, the entry Python image processing libraries performance: OpenCV vs Scipy vs Scikit-Image is the most popular in this blog.